AMBULANCE FORECASTING METHODS
One of the trickiest things in forecasting revenue for ambulance billing is getting a methodology that combines the number of transports, the payer mix of the transports and the payer’s average time of payment.
When your software and your database allow you to easily access and combine that data the result can be an accurate forecast for your P&L and your cash flow. Below I will review a couple of methods to produce an accurate forecast starting with the most simple and expanding into a more detailed and even more accurate method.
All the methods described below are from the Sharp Ambulance Billing dashboard and reporting tools, but should be available in any quality billing software on the market today. Unfortunately, I’ve worked with a lot of internal billing departments and external billing departments that fail to produce even the most basic forecast for their clients.
Many times the reports or forecasting tools that do produce something fail to take into account important factors that make a forecast accurate. Forecasting your cash flow may be less important for a government entity than it is for a private entity, but either should have a basic understanding of their revenue in order to determine they are getting all the revenue available and in a timely fashion.
Let us start with the most basic snapshot available on a good dashboard such as the one in Sharp Ambulance Billing that can provide you the ability to do a fairly easy estimate that is still fairly accurate.
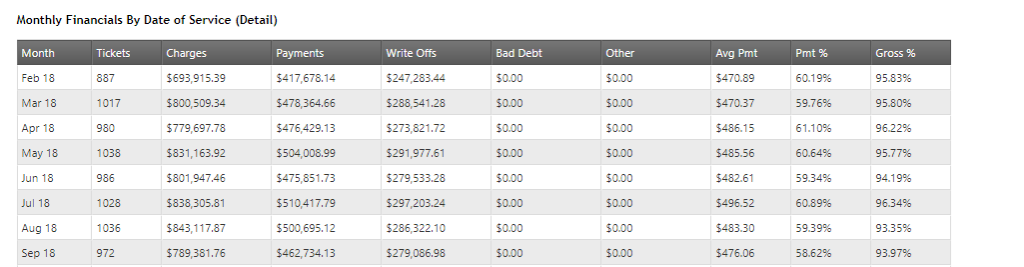
The dashboard below provides some simple forecasting that for many companies is enough to estimate revenue for the near future. The number of runs is tracked because months with more runs will most likely produce more revenue than those with less. In this dashboard (graphs and bar charts not shown) you can quickly see how many runs were done in a month and the associated charges. The charges will vary based on the mix of Level of Service.
The next is payments received for the runs in that month. This is not the month the payments were collected but rather what payments were made against the transports in that month. Combine that with the costs for that month and you can track how profitable a month was.
Also provided are write-offs for contractual payers such as Medicare, Medicaid and other commercial contracts. This is the part of the charges you cannot collect due to contractual obligations. The data allows for a basic forecast in a month. By using this data and the average per run or the average percent paid of the charges (over the last 6-12 months), you can produce a simple forecast.
A forecast can be generated by using one of two simple calculations (or running a report that does it for you). Either taking the charges times percent of charges normally paid, or by taking the average collection per run multiplied by the number of runs to get the current months estimated revenue. Either provides a fairly quick and fairly accurate forecast of the revenue the chosen month will generate in total over time. The second chart/report below can then expand that into the estimate of when that cash/revenue will arrive based on the history of how it arrived before.
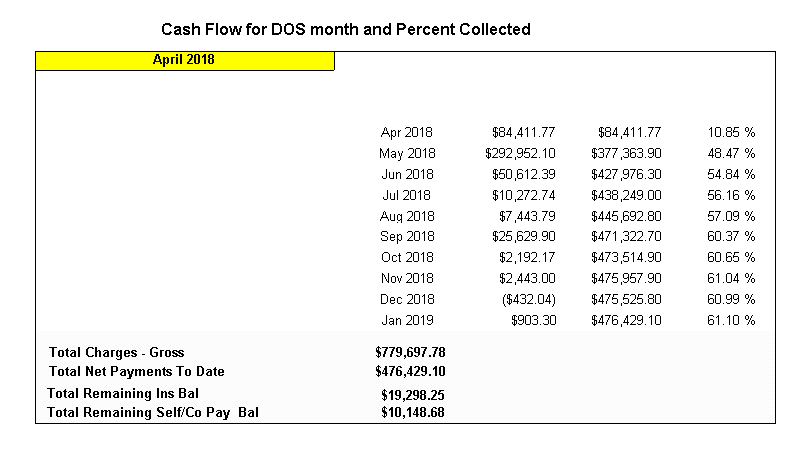
While the Dashboard above tells me April will generate $476 K, the chart below shows me when that income was received, which changes based on payer mixes and their average payment times. And often there is a mix of secondary payers, self-pay deductibles, co-insurance and co-payments and/or slow paying insurance companies. All those variables combine to cause payments to trickle in over time. In the example below for April 2018 we collected a total so far of $476 K. When it was collected is shown on the Cash Flow for DOS Month report, example below is $84 K was collected before the end of the month of April, $293 K was collected before the end of May and $50 K collected before the end of June. Meaning within 60 days of the end of April (or the month I am forecasting cash flow for) I received 81% of the cash that month would eventually generate. Then the next 3 months produced another 9.1%. The other 10% trickled in, some as late as Jan 2019. This could be patients on payment plans, difficult to collect insurance, hospice, workers compensation, VA and many other valid reasons these are not collected sooner.
Regardless of the numbers and timing the forecasting process in its most simple forms are the same. Number of runs multiplied by a typical average payment per run (over time), and payments collected as percent of total charges (over time) allows a fairly solid methods to predict an amount collected, or expected revenue from that months transports. Combine that and the average collected percent per month from the chart below and you have a fairly accurate cash flow forecast of that revenue. Combined with previous months and future months you can accurately forecast a particular month’s cash receipts.
Below this chart I will address a way to make this kind of forecast even more accurate with the Sharp Ambulance Billing tools and hopefully tools you may have in your software.
How do you improve on this method? The key to understanding the best way to improve on this method is to understand where the inaccuracy of this method is. One of the conditions that can change your forecast month-to-month is if you’re payer mix changes fairly significantly month-to-month. A larger mix of lower self paid, no insurance accounts, or a larger mix of insurance such as Medicaid can often affect the amount of cash you will actually collect.
Another factor that changes monthly is often the mix of service level (ALS versus BLS) mix can raise or lower the forecast. While the service level mix is reflected in the total charges for the month, it may affect the average per run in the forecast.
Therefore the next step in providing a more accurate forecast is a report that takes each run individually and looks at the previous history to create a very detailed calculation run by run. That detail is then totaled into a summary of the data. The information can be displayed the same as the previous forecast, but it does the calculations using detailed data not an overview of the past.
Run by run this more accurate and detail forecast adds current month (forecasted month) data and uses the history of the same type of run with the same payer to predict collections to the most accurate level possible.
While Sharp has several methods to produce such a report they all have one thing in common – they take the actual payer and service level run by run and produce expected payment revenue.
For example one of the more accurate ones that Sharp makes available uses the 6-9 month history of those payers to conclude how much should be expected to be collected. Of course, you need to have 6-9 months of history to use this report. Therefore, the first less accurate reports are usually a starting point until such history is available.
These more accurate reports look at primary payers and secondary payers. This process is unique to many reports we use for forecasting. For example the collection rate from a Medicare primary and Blue Cross Secondary might be 100% of the Medicare allowable. Whereas the collection rate of a Medicare Primary and Medicaid in states like California are limited to 80% of the Medicare allowable as Medicaid will pay zero and will not allow the patient to be billed the other 20%.
Then there is the Medicare Primary and Patient secondary. That is where the historical data from a 6-9 month period might tell us a more accurate depiction, for example we only collected 92% of that allowable. If reduced from 100% because too many patients are difficult to collect their co-pays from if at all.
While there are many other ways to make reports more and more accurate they all require historical data, and sophisticated software. Even with the tools it takes someone with the expertise and the ability to understand the software tools and how that data is created to insure it is accurate.
Also can that software and data produce accurate reports customized to the uniqueness of each ambulance company? Many times I have found software that could possibly produce these types of reports and information but the users were simply not capable of making the tool do that. That is where the expertise of your billers and people knowledgeable of the software’s database and reports can combine to make more accurate forecasts.
If you need this type of information today and are not getting it I would suggest finding a way. Either find out how to use your software to produce that type of accurate reporting or begin to look for new software or even a new billing service.
It is most important that if you are reviewing reports for this information that you fully understand how that data you are looking at is calculated. How a forecast is calculated must be known if you are going to rely on that forecast when making business decisions.. I often have asked a customer, how is that data calculated? The same report can produce very different information across software, even something as simple as the average revenue per run. One company report I reviewed only used the paid runs, which produced a significantly better result per run then including runs never paid. But which was more useful when multiplying times run performed in a month. The lower one was more accurate, because every month had a percent of unpaid runs, especially in the 911 business. The first one was higher and might make your billing results look better, but it was not good data for the purpose of forecasting.
In running your business it is vital to have at least the simplest level of information for forecasting (that was discussed at the beginning of this article). It requires good data, good software and a very good understanding of the data and how the software uses it for reporting. Are you capable of getting this from your software? Are the users of your software capable of getting this information?